Soil Management Guide
Soil Erosion
- Background
- Quick facts
- Consult soils report to assess risk of wind erosion
- Conduct site visit to assess risk/evidence of wind erosion
- Recommendations
- Background
- Quick facts
- Consult soils report to assess risk of water erosion
- Conduct site visit to assess risk/evidence of water erosion
- Recommendations
- Background
- Quick facts
- Consult soils report to identify areas prone to tillage erosion
- Site visit to identify areas prone to tillage erosion
- Recommendations to reduce tillage erosion
- Follow-up monitoring
A loss of topsoil can result in a significant loss in productivity, largely due to losses of organic matter and nutrients as well as deterioration of physical soil properties.
“It was found that yields generally decreased as the amount of topsoil removed increased. Data indicated yields to be severely depressed on all topsoil removal treatments where no fertilizer was applied. …On the coarse textured soils, even twice the recommended rate of fertilizer was not able to bring the yields back to that of the control.” (Kapoor and Shaykewich, 1990; Kenyon and Shaykewich, 1987)
A. Wind erosion
Background
Wind erosion is the detachment, movement and removal of soil from the land surface by wind. It can occur naturally, without human intervention, or can be accelerated through human activities such as excessive tillage. Soils most susceptible to wind erosion by texture: sands > clays > loams Soils most susceptible to wind erosion by structure: single-grained (structureless) > crumbly or cloddy
Quick facts
|
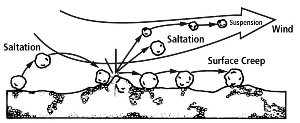 Figure 7.1 Three types of movement of soil particles by wind erosion: surface creep, saltation and suspension |
Consult soils report to assess risk of wind erosion
Look for items that indicate soil susceptibility to erosion:
- texture (see above)
- agriculture capability subclass E (erosion limitation)
- Eroded phases on map: 1xxx, 2xxx, 3xxx, oxxx. Note the first position in the denominator of the soil code refers to the degree of erosion.
xxxx = non-eroded or minimal erosion 1xxx = slightly eroded (25-75% of A horizon removed) 2xxx = moderately eroded (>75% of A and part of B horizon removed) 3xxx = severely eroded (all of A and B horizons removed) oxxx = overblown (subsoil deposited over topsoil)
Example: DRN/xxxx = Durnan; no erosion DRN/1xxx = Durnan, slightly eroded
Conduct site visit to assess risk/evidence of wind erosion
- Identify visual effects of past wind erosion events – blow banks, light coloured knolls, etc.
- Check the depth of black topsoil to determine if erosion or deposition has occurred
- Identify any sandblasting of crops
- Estimate or measure crop residue cover
Method for measuring crop residue cover:
- Use any line, rope or tape that is equally divided into 100 parts at 6 or 12 inch (15 or 30 centimetre) spacings.
- Choose representative locations in the field.
- Stretch the line diagonally across the rows.
- Select a point on one edge of the line markings, and observe that point at each mark.
- Look straight down at that point. Do not count residue smaller than 1/8 inch (3 millimetres) diameter.
- Walk the entire length of the line. Count the total number of marks with residue under them. That count will be the % cover for the field.
- Repeat the procedure at least 5 times in different areas of the field and average the findings.
Figure 7.2 10% crop residue cover |
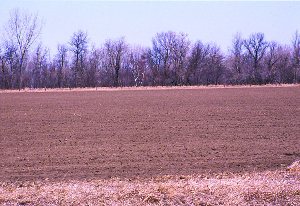 |
| Figure 7.3 35% crop residue cover | 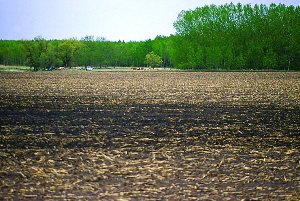 |
| Figure 7.4 65% crop residue cover | 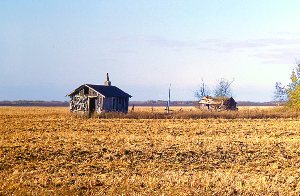 |
Recommendations
a) Prevention:
- Maintain adequate crop residue cover (at least 35% cover just after seeding for most soils, and at least 65% cover for soils highly susceptible to soil erosion) - standing stubble is 1.6 times more effective at controlling wind erosion than flat stubble.
- Establish cover crops – these crops should be solid seeded at the appropriate time and seeding rate (Table 7.1).
- If it is not feasible to plant a cover crop on the entire field, plant on headlands (field perimeter), or on/beside the most susceptible areas.
Table 7.1 Cover crop establishment criteria
| Cover Crop | Seeding Date | Seeding Rate (lb/ac) |
| Fall rye | August 15 - September 12 | 11-23 |
| Small grain | August 15 - September 1 | 25-30 |
| Millet | July 15 - August 15 | 10-15 |
| Sweet clover | May 1 - 15 | 6-10 |
| Alfalfa | May 1 - 15 | 6-8 |
| Red clover | May 1 - 15 | 4-6 |
- Annual barriers of corn or sunflowers should be planted perpendicular to prevailing spring winds to reduce wind erosion after erosion-susceptible crops are harvested.
Table 7.2 Annual barrier establishment criteria
Crop |
Barrier width (ft) | Barrier spacing (ft) | Seeding date |
| Corn/ Sunflowers | 5-12 (1.5-3.6 m) | 60 (18 m) | Normal seeding date |
Shelterbelts reduce wind velocity in the area behind the shelterbelt for a distance up to 30 times the height of the trees. Plant shelterbelts perpendicular to prevailing winds. If planting shelterbelts in the middle of a field is not feasible due to equipment access, consider planting shelterbelts on the north and west edges of the field perimeter to reduce the effects of prevailing winds. Contact Prairie Farm Rehabilitation Administration for more information on shelterbelt design and establishment.
b) Control of blowing soils:
- Emergency tillage of heavier textured soils roughens the land surface to reduce wind velocity and trap drifting soils; creates or brings to the surface aggregates or clods large enough to resist wind erosion.
- Additions of:
- crop residues (1700 to 2000 lb/ac (1910 to 2247 kg/ha) of cereal straw on highly erodible soils) – the straw may have to be wet or anchored to the soil by packing. Potential drawbacks include the introduction of weed seeds and the immobilization of nitrogen due to high C:N ratios in the straw (see Table 8.6 in Chapter 8).
- manure (solid or liquid) may be effective, but avoid excessive nutrient applications and nutrient losses to water sources via leaching and runoff;
- irrigation water – add enough to moisten topsoil to prevent movement (this is a short term fix only, and may not be feasible if water supplies are limited)
B. Water erosion
Background
Water erosion is the detachment, movement and removal of soil from the land surface by precipitation leaving the landscape as runoff. It can occur naturally, without human intervention, or can be accelerated through human activities such as insufficient residue cover on soils prone to runoff. Soil erodibility is affected by surface texture, organic matter content, size and shape of soil aggregates and the permeability of the least permeable horizon. Susceptibility to soil erosion by texture: clays or loams > sands Susceptibility to soil erosion by structure: single-grained (structureless) > crumbly or cloddy Rainfall quantity, intensity and duration influence the extent of water erosion. Intense rainstorms of more than 1 inch per hour (2.5 centimetres per hour) exceed most soils’ capacity to absorb water, creating runoff conditions which lead to water erosion on unprotected fields. The degree of soil erosion is affected by slope length and steepness - doubling the length of a slope increases soil losses by 1.5 times; doubling the incline of a slope increases soil losses by 2.5 times
| % slope = | rise X 100% |
| run |
Quick facts
- Maximum tolerable loss: 5 tons/acre/year (10 tonnes/hectare/year) = 0.03 inches (0.75 millimetres) thickness of topsoil on a well-developed soil.
- Pulse crops and potatoes usually do not leave enough residue on the surface to prevent erosion once these fields are cultivated – these crops are usually grown on the most erodible soil types.
- The most susceptible period for soil erosion by water is during spring snowmelt and May-June, after seeding but before canopy cover.
- Flat stubble is more effective at preventing water erosion than standing stubble.
Consult soils report to assess risk of water erosion
Look for:
- T subclasses in the agriculture capability rating for a given soil series or phase, indicating a slope limitation. The exception to this would be with sandy soils, or soils with an M (moisture) limitation. Water infiltrates faster than it can run off on coarse textured soils, reducing the risk of water erosion regardless of slope.
- agriculture capability subclass E (erosion limitation)
- “rapid surface runoff” in soil series description
- Slope phases on map: xbxx to xhxx. Note the second position in the denominator of the soil code refers to the degree of erosion.
x = 0 - 0.5% (level) b = 0.5 - 2% (nearly level) c = 2 - 5% (very gently sloping) d = 5 - 9% (gently sloping) e = 9 - 15% (moderately sloping) f = 15 - 30% (strongly sloping) g = 30 - 45% (very strongly sloping) h = 45 - 70% (extremely sloping)
Example: MXS/xxxx = Manitou; level slope MXS/xbxx = Manitou, 0.5-2% slopes MXS/xcxx = Manitou, >2-5% slopes MXS/xdxx = Manitou, >5-9% slopes MXS/xexx = Manitou, >9-15% slopes
Table 7.3 Using % slope to make management decisions to prevent soil erosion by water
| % Slope | Description | Recommended Use | % Cover Required* |
| 0-5% | Level to very gentle slopes | Annual and row crop production | 35 |
| >5-9 ("d" slope in soil survey reports) | Gentle slopes | Annual crop production | 35-50 |
| >9-15 ("e") | Moderate slopes | Crop rotation: 2/3 forage production 1/3 annual crop production | 50-70 |
| >15-30 ("f") | Steep slopes | Forage production | |
| >30 ("g") | Very steep slopes | Native production |
*Flat cereal residue required for effective erosion control
Conduct site visit to assess risk/evidence of water erosion
- Identify visual effects of past water erosion events – in-field channels, gullies, etc.
- Check the depth of black topsoil to determine if erosion or deposition has occurred.
- Estimate or measure crop residue cover.
Recommendations
Crop management to minimize water erosion: forages > cereals > row crops Buffer strips of forages in sensitive areas may be appropriate.
- Establish grassed waterways with side slopes no more than 25% (1 unit rise to 4 units run); > 16 feet (4.8 metres) wide, > 6 inches (15 centimetres) deep.
- Manage riparian areas appropriately in order to minimize streambank erosion.
- Adopt conservation tillage practices (i.e. any tillage and planting system that leaves at least 30% of the soil surface covered by the previous year’s crop residue after planting).
- Consider the establishment of permanent cover – sensitive areas may be taken out of annual crop production for forage production, pasture production, or as a set aside for non-agricultural uses. It may be most beneficial to establish permanent cover on headlands or at points where soil and water are likely to exit the property.
C. Tillage erosion
Background
Tillage erosion is the progressive downslope movement of soil by tillage causing soil loss on hilltops (knolls) and soil accumulation at the base of slopes (depressions). Tillage erosion is described in terms of erosivity and landscape erodibility. Large, aggressive tillage implements, operated at excessive depths and speeds are more erosive, with more passes resulting in more erosion. Landscapes that are very topographically complex (with many short, steep, diverging slopes) are more susceptible to tillage erosion. Visual evidence of tillage erosion includes: loss of organic rich topsoil and exposure of subsoil at the summit of ridges and knolls; and undercutting of field boundaries, such as fence lines, on the downslope side and burial on the upslope side. Tillage erosion has only recently been recognized as a form of soil erosion. Studies across North America and Europe have concluded that tillage erosion is the major cause of the severe soil loss and crop yield loss observed on hilltops. The soil loss on hilltops resulting from tillage erosion reduces crop productivity and increases field variability. Rates of soil loss on these slope positions are often more than ten times what is considered to be tolerable for sustainable production. Consequently, yield losses associated with these areas are as high as 30 to 50%. This type of erosion occurs subtly as compared to wind and water erosion and usually results in a redistribution of topsoil within the field (i.e. the net soil loss is roughly zero, but the net loss in soil productivity on the knolls can be dramatic). This concept is reinforced from wheat yields in Idaho (Norris and Comis, 1982).
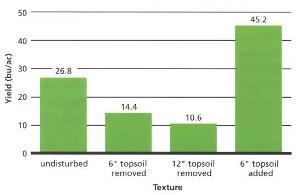 Figure 7.5 Effect of topsoil on wheat yields in Idaho |
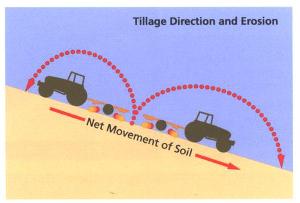 Figure 7.6 Movement of soil by tillage erosion |
Quick facts
- Tillage erosion occurs only during tillage operations.
- All field operations that disturb the soil cause some tillage erosion, even operations such as seeding, row crop cultivation, root crop harvesting, manure injection, etc.
- The heavy duty cultivator moves 10 pounds of soil per foot width of tillage (15 kilograms of soil per metre) on level land, but moves 17 to 20 pounds (25 to 30 kilograms) when tilling down a 15 to 20% slope and less than 3.5 pounds (less than 5 kilograms) when tilling up that slope.
- Root crop harvesting can cause more tillage erosion than plowing.
- The majority of soil moved by tillage is only moved 6 to 12 inches (15 to 30 centimetres), but some soil will be dragged as far as 6 to 10 feet (2 to 3 metres) and greater distances when tilling down slope.
- The soil lost from hilltops by tillage erosion is not lost from the field; it simply accumulates at the bottom of the hills.
- The soil that accumulates at the bottom of the hills is not degraded by the erosion process.
- Tillage erosion moves soil down slope to areas where water erosion is most intense, so tillage erosion is linked to water contamination.
- Maximum tolerable loss: 5 tons/acre/year (10 tonnes/hectare/year) = 0.03 inches (0.75 millimetres) thickness of topsoil on a well-developed soil.
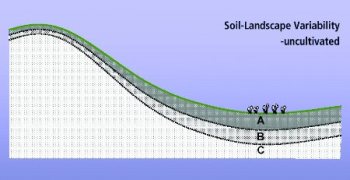 |
| Figure 7.7 An undisturbed landscape prior to the effects of tillage erosion |
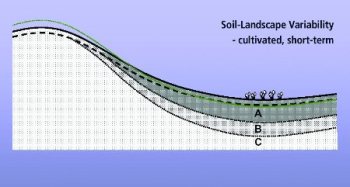 |
| Figure 7.8 A cultivated landscape showing the short-term effects of tillage erosion. Topsoil is being removed from the knolls and accumulating in the depressions. |
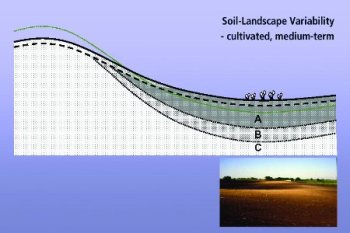 |
| Figure 7.9 Medium-term effects of tillage erosion, typical of many prairie landscapes in their current condition. Topsoil is almost completely removed from knolls and depressions have thick layers of topsoil due to accumulation. Yield variability across the landscape is significant. |
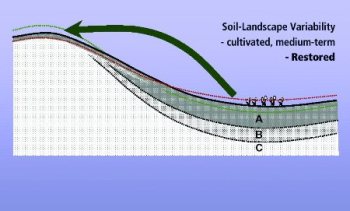 |
| Figure 7.10 Landscape restoration - the practice of moving some of the accumulated topsoil from depressions back onto the knolls at a depth of 4 to 6 inches (10 to 15 centimetres) - is recommended to restore productivity to the knolls and reduce crop yield variability in the field. |
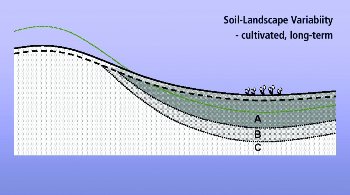 |
| Figure 7.11 Long-term effects of tillage erosion. If allowed to continue, tillage erosion will move subsoil from the knolls onto the depressions, burying the topsoil and reducing yield productivity in these areas as well. |
Consult soils report to identify areas prone to tillage erosion
Tillage erosion has only been recently recognized and, therefore, it is not clearly reflected in soils reports. However, there is information in these reports that does help in the identification of areas prone to tillage erosion as well as wind and water erosion.
- E subclass in the agriculture capability rating for a given soil series or phase, indicating an erosion limitation.
- T subclass in the agriculture capability rating for a given soil series or phase, indicating a slope limitation. Land with steep slopes will have greater rates of both water and tillage erosion.
- Eroded phases on maps: 1xxx, 2xxx, and 3xxx often indicate soil loss by tillage erosion, particularly when those eroded phases appear on hilltops (see examples under wind and water erosion).
- Slope phases on maps: xbxx to xhxx (see examples under water erosion). Steeper slopes have greater rates of tillage erosion. As steepness of slope increases, the difference in the amount of soil moved down slope by downslope tillage and up slope by upslope tillage increases.
Site visit to identify areas prone to tillage erosion
- Land that is hilly is sensitive to tillage erosion. Fields with many small hills are more prone to tillage erosion than fields with a few large hills. Hummocky land is more sensitive to tillage erosion than undulating land and is much more sensitive than rolling land.
- Land that has shallow topsoil or has areas where topsoil is shallow, like hilltops, is most sensitive to any form of soil erosion.
- Even land that is considered to be flat can suffer from tillage erosion. Tillage erosion is probably the major cause for the infilling of surface drains in cultivated lands.
Recommendations to reduce tillage erosion
1. Reduce tillage frequency All unnecessary tillage operations should be eliminated from a tillage system. Tillage should be done when soil conditions are suitable to avoid correctional tillage. If possible, a reduced- or zero-tillage system should be adopted.
2. Reduce tillage intensity The depth and speed at which a tillage implement is operated affect its intensity and, therefore, its erosivity. Tillage implements should be operated at minimum recommended depths and speeds.
3. Reduce tillage speed and depth variability Operators should try to maintain a constant tillage depth and tillage speed, even in hilly landscapes. Variability in tillage depth and speed contributes to tillage erosion. To maintain constant operating depth and speed in hilly landscapes requires more power from a tractor than would be recommended for a specific tillage implement by an equipment manufacturer or dealer. Implements are rated for required horsepower assuming that they will be operated on level ground. Operation in excess of recommended depth and speed results in greater variation in soil movement, and, consequently, results in greater tillage erosion.
4. Reduce the size of tillage implements The larger the implement is relative to the size of the hills, the more rapid the landscape is leveled. Tillage implements which are very long and/or very wide should be avoided on landscapes which are highly susceptible to tillage erosion. Some large implements have flexible frames which allow them to conform to the shape of the landscape and, therefore, are less erosive.
5. Use contour tillage Where possible, tillage should be conducted along the contour of the landscape. This will reduce the variation in tillage depth and speed and, consequently, reduce tillage erosion.
6. Use a reversible moldboard plow Where tillage is conducted on the contour, a reversible/rollover/two-way moldboard plow can be used to throw the furrow upslope, leaving a back furrow on the uppermost slope position. This works against the progressive downslope movement of soil by other tillage implements (Foster, 1964). The most effective way to arrest tillage erosion is to eliminate tillage; however, it is not always desirable to do so. Where tillage is used, there are practices which can be used to reduce tillage erosion. Improvements to tillage practices should be made immediately. Practices which require the purchase of equipment may or may not provide short-term economic benefits. Individual Beneficial Management Practices (BMPs) to reduce tillage erosion may or may not reduce soil loss to tolerable levels. There are a few additional considerations regarding the reduction of tillage erosion:
- Where the soil degradation from tillage erosion is a problem and it is not possible to implement BMPs to reduce tillage erosion to a tolerable level, it may be advisable to take the land out of crop production which requires tillage.
- Where it is feasible, areas which are severely degraded by tillage erosion should be restored by returning the topsoil which has accumulated downslope and/or by applying amendments such as livestock manure. This should be followed by the implementation of BMPs to reduce tillage erosion.
- Field boundaries such as fences and terraces compound soil losses by tillage erosion and careful consideration should be given to their placement within the landscape.
Follow-up monitoring
- Measure tillage depth and the amount of surface area disturbed, taking particular note of depths during upslope tillage and downslope tillage. Keep records.
- Monitor the speed of all operations that disturb soil, taking particular note of speeds during upslope tillage and downslope tillage. Keep records.
- Conduct soil testing for organic matter and nutrient status. Compare results from hilltops to those from the back of hills and at the bottom of hills. Track changes over time.
- Use a crop yield monitor and maps to compare results from hilltops to those from the back of hills and at the bottom of hills. Track changes over time.
